Sample preparation for cryo-ET
Cryo-ET samples were prepared using 200-mesh R2/2 copper grids (Quantifoil) plasma-cleaned for 30 s in 75% argon/25% oxygen using a 1070 plasma cleaner (Fischione). S. pombe cells were grown for 7 days in EMM containing 0.5% (w/v) glucose and diluted in glucose-free EMM to OD600 = 0.6 immediately before freezing. A 4 µl aliquot was applied to the carbon side of the grid and back-side blotted for 1 s (Whatman 597 paper; paper contact sensing mode with 1.5 mm movement) using a Leica EM GP2 plunger operated at 23 °C and 100% humidity. Grids were vitrified in liquid ethane.
Cryo-FIB milling
Vitrified grids were mounted in Cryo-FIB Autogrids (ThermoScientific, 1205101) under liquid nitrogen and transferred to an Aquilos 2 cryo-FIB/SEM (ThermoScientific). The stage and anti-contamination shield were maintained at −194 °C. After scanning electron microscope screening (5 kV, 13 pA), grids were coated with trimethyl(methylcyclopentadienyl)platinum(IV) (GIS, 120 s), preceded and followed by 15 s sputter coating (30 mA). Positions were set using MAPS, and lamellae were milled using AutoTEM (30 kV; 1 nA to 30 pA) and thinned manually to ~160 nm at 30 pA. During final thinning, the stage was tilted by +0.5° to improve surface polishing and reduce curtaining. A final sputter coating (3 s, 10 mA) reduced charging during transmission electron microscopy acquisition and facilitated tilt-series alignment.
Mitochondria-focused cryo-ET acquisition
Data collection
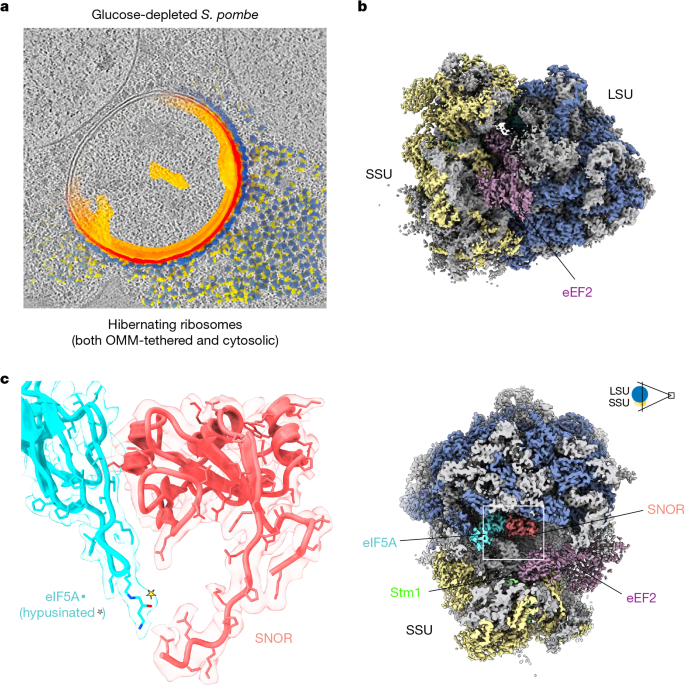
To initially assess ribosomes proximal to mitochondria, lamellae were screened and tilt series were targeted to mitochondrial regions. Data were collected on a Titan Krios G4i (ThermoScientific) operated at 300 kV, equipped with an energy filter and Falcon4i detector in zero-loss mode. Lamellae were mapped at 14.39 Å per pixel (−70 µm defocus; 70 µm objective aperture; 20 eV slit). Mitochondria were selected in SerialEM44, guided by SPACEtomo segmentation and PACEtomo45 for beam image-shift parallel acquisition. Tilt series were acquired at 64,000× (1.933 Å per pixel), using a 50 µm C2 and 70 µm objective aperture (10 eV slit), in nanoprobe mode (spot size 5; 1.4 µm illumination). A dose-symmetric scheme (3° increments, −65° to +49°, centred on ~−8° pre-tilt) was used. Movies were recorded in counting mode (880 ms; ~3.34 e− Å−2 per tilt; total dose ~130 e− Å−2). Target defocus ranged from −2 to −6 µm. Seventy-eight tilt series were selected for subtomogram averaging based on dose, thickness, contamination and cellular integrity.
Data processing
Stage tilts in .mdoc files were corrected for lamella pre-tilt. EER frames were converted to TIFF (RELION v4.0.146), motion-corrected, and contrast transfer function (CTF)-estimated (−2 to −10 µm) in Warp 1.0947. After manual inspection, tilt series were aligned in AreTomo248, defocus handedness verified, and 3D-CTF–corrected tomograms reconstructed at 15.44 Å per pixel in Warp.
Ribosome picking and classification
Ribosomes were identified using PyTom(1.1)49 template matching with a 40 Å low-pass–filtered S. pombe OMM-associated ribosome map (EMD-50266). To distinguish OMM-tethered from cytosolic ribosomes, mitochondrial membrane masks were generated. Two tomograms were segmented in Dragonfly (Comet Technologies) to train a 2.5D U-Net (five-slice input; depth 5; patch size 64 pixels), which was applied batch-wise to generate dilation masks around mitochondria. Masked particles were extracted and curated in ArtiaX50.
Subtomogram averaging
Particles were extracted in Warp and refined in RELION. After iterative 3D classification and refinement, particles were optimized in M (part of the Warp–M suite developed for high-resolution in situ cryo-EM and cryo-ET data refinement)47 for pose, deformation, and CTF parameters. cryoDRGN-ET51 enabled unsupervised classification, followed by further refinement in M. The final OMM-associated ribosome reached 6.0 Å resolution (Fourier shell correlation (FSC) = 0.143). Cytosolic ribosomes, curated separately, were refined to 6.6 Å resolution (Extended Data Fig. 1 and Supplementary Fig. 2).
Whole-cell high-resolution in situ cryo-ET
Data collection
To obtain a comprehensive and higher-resolution view, we next collected a large dataset sampling ribosomes throughout the cell. Lamellae (<20 µm width) were prepared as above to minimize beam-image shift. Tilt positions were distributed across the entire cell and grouped within <15 µm focus distance to reduce beam-shift aberrations. Data were collected at 1.526 Å per pixel (Extended Data Fig. 1). In total, 1,012 tilt series were acquired across three dose groups (group 1: 518; 3.33 e− Å−2; group 2: 375; 3.49 e− Å−2; group 3: 85; 3.59 e− Å−2).
Preprocessing and reconstruction
Preprocessing (EER to tomogram) was automated in AreTomo348. Bad tilts were excluded (DarkTools threshold = 0.8), and alignment, thickness estimation, and pre-tilt correction were automated. Only tomograms with 60–225 nm thickness and <100 nm global shifts were retained. EER fractions were converted to TIFF and upsampled (0.763 Å per pixel) for motion correction and per-tilt CTF estimation in Warp (v2.0.0dev36). Tomograms were reconstructed with 3D CTF correction at 12.208 Å per pixel.
Subtomogram averaging and refinement
Seventy-four group 3 tilt series were first processed. Ribosomes were identified using PyTom (v0.7.2) using the previous 5.5 Å consensus hibernation map (Extended Data Fig. 1a; 30 Å low-pass–filtered) as template, yielding 9,071 candidates. After RELION (v4.0.1) refinement/classification, 8,829 particles were refined in M (v2.0.0dev36) with iterative optimization of ImageWarp, ParticlePose, per-particle defocus, VolumeWarp, stage-angle, and deformation grids. This subset reached 4.73 Å resolution and was used as an improved template for template matching in the remaining 715 tomograms, yielding 95,485 particles. After RELION cleanup, 88,206 particles were refined in Warp/M at 1.526 Å per pixel. Tilt-series and per-tilt contributions were weighted during refinement. Third-order Zernike polynomials modelled higher-order aberrations once sub-4 Å resolution was reached. Final refinement after upsampling to 1.0 Å per pixel yielded a 3.38 Å reconstruction (FSC = 0.143). Local resolution analysis showed improved resolution in the ribosomal core and SNOR/eIF5A region which is resolved between 2.8 and 3.3 Å resolution (Extended Data Figs. 1 and 2).
Gene detection and phylogenetics
Annotated protein sequences for all fungal (2,248 genomes) and mammalian (263 genomes) reference genomes (available on GitHub at https://github.com/cassprince/SNOR_conservation) were downloaded from the NCBI RefSeq database on 28 December 2024 and 3 April 2025, respectively. This resulted in a subset of RefSeq that includes approximately one genome per species52,53. SNOR protein sequences were detected using HMMER v3.3 (hmmsearch) (hmmer.org; Supplementary Table 3) with an E-value cutoff of 0.05. To search for SNOR, HMMER profiles were built with six protein sequences annotated as Rtc3 from Ascomycota genomes by the NCBI Eukaryotic Genome Annotation Pipeline53. Query sequences are given in Supplementary Table 3. Only protein hits fewer than 200 amino acids in length were considered SNOR candidates to minimize the likelihood of detecting larger aberrant SBDS proteins.
18S rRNA sequences from the fungal genomes described above were analysed using a previously described workflow54. In brief, the sequences were identified using BLAST v2.16.0, aligned using MAFFT v7.520, and applied to FastTree v2.1.10 to produce a maximum-likelihood tree. The constructed tree was midpoint rooted with the phangorn v2.12.1 package and visualized with ggtree v3.12.0. Taxonomic classifications were assigned according to the NCBI Taxonomy database. The complete list of genome accession numbers, taxonomic classification, and SNOR presence for all surveyed genomes can be found on Figshare (https://doi.org/10.6084/m9.figshare.31350286 (ref. 33)).
RT–qPCR
S. pombe cells were grown overnight at 30 °C with agitation in YES medium, then transferred to EMM supplemented with 0.5% (w/v) glucose and cultured for an additional 3 days. Culture samples were collected daily and flash frozen in liquid nitrogen for subsequent analysis. RNA was extracted from 107 cells per sample, using the RNeasy Kit (QIAGEN, 74104) following the manufacturer’s protocol. Quantity and quality of RNA samples were assessed using a NanoDrop (Thermo Scientific). cDNA was synthesized using the Verso cDNA Synthesis Kit (Thermo Scientific, AB1453A). Real-time quantitative PCR was performed on the StepOne Plus system (Applied Biosystems) using SYBR Green Master mix (Thermo Scientific, A25742). Gene expression levels were quantified using the ΔΔCt method and normalized to the expression of the housekeeping gene act1 (actin). Primer sequences are listed in Supplementary Table 4.
Monitoring SNOR protein levels using different stress conditions
S. pombe cells were grown overnight at 30 °C with agitation in EMM. The overnight cultures were washed 3 times with PBS (Phosphate Buffered Saline) and used to inoculate fresh EMM supplemented with either 0, 0.5, 2 or 20% glucose or EMM (2% glucose) lacking either amino acids or nitrogen or EMM (2% glucose) supplemented with high levels of salt (1.1 M NaCl). Cells were inoculated to a starting OD600 of 0.1 and cultured at 30 °C with constant agitation for 40 min after which samples were collected for cell lysis. For cell lysis 1.5 OD600 units of cells were resuspended in 500 μl water. Fifty microlitres of 1.85 M NaOH was added and incubated on ice for 10 min. Trichloroacetic acid (TCA) was then added to a final concentration of 10%, followed by an additional 10 min incubation on ice. Samples were centrifuged at 14,000g for 15 min at 4 °C. Pellets were then resuspended in 1× SDS–PAGE sample buffer (50 mM Tris-HCl pH 6.8, 2% SDS, 1% β-mercaptoethanol, 6% glycerol, 0.004% bromophenol blue) for western blot analysis. Proteins were resolved using SurePAGE gels (GenScript, M00653) with MES running buffer (GenScript, M00677) and transferred onto 0.2 μm nitrocellulose membranes (LI-COR, 926-31092). Membranes were blocked for 1 h at room temperature in 5% milk prepared in 1× PBST (0.1% Tween-20). After blocking, antibodies diluted in 2% milk in 1× PBST were incubated with membranes. Primary antibodies used: Flag (Genscript, A00187) and GAPDH (Proteintech, 60004-1-Ig). Secondary antibodies used: anti-mouse (Invitrogen, A21058). The LI-COR Odyssey imager was used for detection.
Ribosome purification
S. pombe cells were cultured overnight at 30 °C with agitation in 500 ml of YES medium. Cells were collected by centrifugation at 3,000g for 5 min at room temperature, washed with lysis buffer (20 mM HEPES pH 7.4, 100 mM KCl, 5 mM MgCl2, 1% (v/v) Triton X-100), and centrifuged again at 5,000g for 5 min. The resulting pellet was resuspended in lysis buffer supplemented with 0.04 U µl−1 RNase inhibitor (RiboLock, Thermo Fisher, EO0382) and flash frozen in liquid nitrogen as small drops. Frozen pellets were ground to a fine powder in a mortar and pestle under liquid nitrogen. The powder was resuspended 1:1 (v/w) in lysis buffer and the lysate was clarified by centrifugation at 5,000g for 5 min at 4 °C to remove cell debris, followed by a second centrifugation at 14,000g for 10 min at 4 °C. The resulting supernatant was layered over a 50% sucrose cushion (50% w/v sucrose, 20 mM HEPES pH 7.4, 100 mM KCl, 5 mM MgCl2) and centrifuged at 43,000 rpm (50.2 Ti rotor, ~225,000g) for 20 h at 4 °C. Following centrifugation, the ribosome pellet was resuspended in either resuspension buffer (20 mM HEPES pH 7.4, 60 mM KCl, 5 mM MgCl2) or ribosome splitting buffer (20 mM HEPES pH 7.4, 1 M KCl, 5 mM MgCl2, 1 mM puromycin). For subunit separation, ribosome samples were incubated in ribosome splitting buffer for 1 h at 4 °C, then loaded onto a continuous 10–40% sucrose gradient (10–40% w/v sucrose, 20 mM HEPES pH 7.4, 500 mM KCl, 5 mM MgCl2, 1 mM DTT) and centrifuged at 21,000 rpm for 20 h at 4 °C. Gradients were analysed using a BIOCOMP Piston Gradient Fractionator system, and fractions corresponding to the small and large ribosomal subunits were collected. Subunit samples were concentrated using Amicon Ultra Centrifugal Filter Concentrator tubes (100 kDa MWCO, Millipore, ref. UFC8100). Three biological replicates of crude ribosomes were purified from cells grown under normal conditions and from cells subjected to 7 days of glucose depletion and were analysed by mass spectrometry.
LC–MS/MS analysis of ribosomes
Crude S. pombe ribosome samples purified from normal conditions (day 1) and glucose-depleted conditions (day 7) were processed by Taplin Biological Mass Spectrometry Facility. 10 µl (20 ng µl−1) of modified sequencing-grade trypsin (Promega) was spiked into ribosome sample in resuspension buffer (20 mM HEPES, 5 mM MgCl2, 100 mM KCl) and the samples were placed in a 37 °C room overnight. Samples were acidified by spiking in 10 µl 20% formic acid solution and desalted by STAGE tip55. On the day of analysis the samples were reconstituted in 5–10 µl of HPLC solvent A (2.5% acetonitrile, 0.1% formic acid). A nano-scale reverse-phase HPLC capillary column was created by packing 2.6 µm C18 spherical silica beads into a fused silica capillary (100 µm inner diameter × ~30 cm length) with a flame-drawn tip56. After equilibrating the column each sample was loaded via a Thermo EASY-LC (Thermo Fisher Scientific). A gradient was formed and peptides were eluted with increasing concentrations of solvent B (90% acetonitrile, 0.1% formic acid). As peptides eluted they were subjected to electrospray ionization and entered into an Orbitrap Exploris480 mass spectrometer (Thermo Fisher Scientific). Peptides were detected, isolated, and fragmented to produce a tandem mass spectrum of specific fragment ions for each peptide. Peptide sequences (and hence protein identity) were determined by matching protein databases with the acquired fragmentation pattern by the software program, Sequest57 (Thermo Fisher Scientific). All databases include a reversed version of all the sequences, and the data was filtered to between a one and two percent peptide false discovery rate. The complete list of identified peptides can be found on Figshare (https://doi.org/10.6084/m9.figshare.31350286 (ref. 33)).
Recombinant SNOR, SNOR mutants and eIF5A purification
A pET28a vector encoding N-terminal 6× His-tagged SNOR or eIF5A was expressed in E. coli BL21-CodonPlus (DE3) competent cells (Agilent, 230245). Site-directed point mutations in SNOR were generated using the QuickChange mutagenesis kit (Agilent, 210518) and validated by whole plasmid sequencing by Plasmidsaurus. Cells were cultured in LB medium (Fisher Bioreagents, BP1426) at 37 °C until reaching an OD600 = ~0.6. Protein expression was induced with 1 mM IPTG, followed by overnight incubation at 18 °C. Cells were collected by centrifugation, and the resulting pellet was resuspended in lysis buffer (50 mM HEPES pH 7.5, 1 M KCl, 10% glycerol, 6 mM β-mercaptoethanol, 0.5× protease inhibitor cocktail) and lysed using a French Press. The lysate was clarified by two rounds of centrifugation at 20,000 rpm for 30 min at 4 °C using a 50.2 Ti rotor. The cleared supernatant was loaded onto a 5 ml HisTrap HP column (Cytiva, 17524802) using a P1 pump at 4 °C and washed with 1–2 column volumes (CV) of wash buffer (50 mM HEPES-KOH pH 7.5, 500 mM KCl, 15 mM imidazole, 10% glycerol, 6 mM β-mercaptoethanol). The column was then transferred to an ÄKTA Pure fast protein liquid chromatography system (Cytiva) and washed with an additional 5 CV of wash buffer. Bound proteins were eluted using a step gradient with 2–3 CV of 15%, 30% and 80% Elution Buffer (50 mM HEPES-KOH pH 7.5, 500 mM KCl, 300 mM imidazole, 10% glycerol, 6 mM β-mercaptoethanol). Fractions corresponding to the 30% and 80% elution peaks were pooled and transferred to 7 kDa MWCO dialysis tubing (ThermoFisher, 27968700), then dialysed overnight at 4 °C in dialysis buffer (50 mM HEPES-KOH pH 7.5, 150 mM KCl, 30 mM imidazole, 10% glycerol). The protein samples were subsequently concentrated using Amicon Ultra Centrifugal Filter Concentrator tubes (3 kDa MWCO, Millipore, UFC8003), aliquoted, flash frozen in liquid nitrogen, and stored at –80 °C.
Ribosome co-pelleting assay
The 40S, 60S and 80S ribosome samples were thawed on ice and diluted to 1 µM using Binding buffer (50 mM HEPES pH 7.7, 150 mM KCl, 15 mM MgCl2, 0.02% C12E8, 5% v/v glycerol). Purified wild-type SNOR and SNOR point mutants, as well as purified wild-type eIF5A were thawed on ice and diluted to 75 µM using the Binding buffer. To prepare the reactions, the purified ribosome samples were added to a final concentration of 0.2 µM and the purified protein samples were added to a final concentration of 2 µM. The reactions were incubated for 30 min at 30 °C and layered (1:1) over a 40% sucrose cushion (40% w/v sucrose, 20 mM HEPES pH 7.4, 100 mM KCl, 5 mM MgCl2). Samples were centrifuged at 100,000 rpm for 2 h at 4 °C. Following the spin, the supernatant was discarded and the resulting pellet was resuspended in 1× SDS–PAGE sample buffer (50 mM Tris-HCl pH 6.8, 2% SDS, 1% β-mercaptoethanol, 6% glycerol, 0.004% bromophenol blue) for analysis by western blot. Samples were resolved on a SurePAGE gel (Genscript, M00653) using MES buffer (Genscript, M00677) and transferred onto a 0.2 μm nitrocellulose membrane (LI-COR, 926-31092). Membrane was blocked in 5% milk in 1× PBST (0.1% Tween-20) for 1 h at room temperature. After blocking, antibodies diluted in 2% milk in 1× PBST were incubated with membranes. Primary antibodies used: 6× His (Genscript, A00186), RPS6 (Cell Signaling, 2217), RPL4 (Invitrogen, cat. no MA5-56865). Secondary antibodies used: anti-mouse (Invitrogen, A21058), anti-rabbit (Invitrogen, A32735). The LI-COR Odyssey imager was used for detection.
Cryo-EM sample preparation and data collection
The large ribosomal subunit and recombinant SNOR protein were purified as described above. Freshly prepared 60S ribosome samples were diluted to 270 ng µl−1 in resuspension buffer A (20 mM HEPES-KOH pH 7.4, 60 mM KCl, 5 mM MgCl2). To reconstitute the 60S–SNOR complex, purified SNOR protein was initially diluted using buffer A and added to the reaction to a final concentration of 1 µM. The reaction was incubated for 30 min at 30 °C and then moved to ice. Quantifoil Cu200 R2/2 grids were coated with a 3 nm carbon layer using a Safematic carbon coater (Rave Scientific) prior to sample application. Grids were plasma-cleaned for 15 s at 15 mA using a Pelco easiGlow system to render the surface hydrophilic. Five microlitres of the reaction mixture were then applied to the grids, followed by a 60 s incubation. Grids were blotted for 9 seconds at blot force +7 and plunge-frozen in liquid ethane using a Vitrobot Mark IV (ThermoScientific) operated at 4 °C and 100% humidity. Cryo-EM data acquisition was carried out using a Titan Krios transmission electron microscope (ThermoScientific) operated at 300 kV. The microscope was equipped with a K3 direct electron detector and a Gatan Quantum energy filter set to a 10 eV slit width. Movies were recorded in counting mode at a nominal magnification of 105,000×, yielding a calibrated pixel size of 0.84 Å. A total of 7,277 movies were acquired, each consisting of 40 frames and accumulating a total electron dose of 50 e– Å−2. The target defocus range was set between −1.6 and −0.6 μm.
Cryo-EM data processing
Cryo-EM movies were motion-corrected and dose-weighted using cryoSPARC58, and CTF parameters were estimated for each micrograph in RELION59. An initial set of 821,035 particles was picked using a Laplacian blob-based picker in RELION. Ab initio reconstruction and an initial round of 3D classification were then performed to identify ribosomal particles. After the first round of 3D classification, 324,887 particles containing SNOR were retained, while particles that showed low-resolution features or did not yield a meaningful 3D 60S class were excluded. A second round of 3D classification was performed to improve particle homogeneity, followed by focused 3D classification with signal subtraction using a soft mask encompassing the SNOR region to enhance local resolution. Selected particles were subjected to 3D auto-refinement, per-particle CTF refinement, and beam-tilt correction in RELION. The final reconstruction was obtained from 110,548 particles and sharpened. Global resolution was estimated using gold-standard FSC between independently refined half-maps, applying the FSC = 0.143 criterion.
Model building
Large ribosomal subunit and SNOR complex
Following data processing, a previously generated model of the S. pombe large ribosomal subunit (PDB: 9AXU) and AlphaFold prediction model of SNOR (AF-Q9P7K6-F1-v4) were docked into the cryo-EM map using ChimeraX. SNOR was further rigid body fit into the observed density using COOT and manually adjusted based on the observed density. PHENIX was used to refine the model in the 60S–SNOR map with five macrocycles of real-space refinements applying Ramachandran, side-chain rotamer, protein secondary structure and nucleotide restraints to correct for clashes. The final model was validated using MolProbity in PHENIX. All figure generation was done using ChimeraX.
In situ cryo-ET hibernating 80S ribosome
The previously determined S. pombe ribosome model (PDB: 9AXV) was docked into the in situ cryo-ET map using ChimeraX. Homology models of eEF2 and Stm1 were generated by using PHYRE260 with one-to-one threading and aligning S. pombe sequences to the AlphaFold predicted structures of their respective S. cerevisiae homologues. The generated models were docked into the cryo-ET map using ChimeraX and further adjusted as rigid bodies in COOT based on the local density features and visible side chains. AlphaFold models of SNOR and eIF5A were initially fitted as rigid bodies into the cryo-ET density and manually adjusted based on the resolved side chains of the amino acids and the high-quality local EM density in this region. The L1 stalk and uL1 protein were manually adjusted in COOT based on the corresponding EM density. The complete atomic model of the hibernating S. pombe 80S ribosome was refined against the in situ cryo-ET map using five macrocycles of real-space refinement in PHENIX, applying Ramachandran, side-chain rotamer, protein secondary structure, and nucleotide restraints. The final model was validated using MolProbity as implemented in PHENIX.
Small-scale in vitro translation
Purified mRNA of N-terminal 3× Flag-tagged reporter and residues 1-38 of filamin C connected via a linker was translated in RRL (Promega, L4540). The lysate was diluted to 66.7% (v/v) with a translation mix containing purified RNA (final concentration 0.5 µg µl−1), 3 µM SNOR, 3 µM eIF5A, a combination of both, or 3 µM BSA as a control. The final reaction buffer also included 0.04 U µl−1 RNase inhibitor (Promega), 0.5× protease inhibitor cocktail (Promega), 81 mM KCl, 2 mM magnesium acetate, and 24 µM amino acid mix. Reactions were incubated at 32 °C for 25 min, then placed on ice. Following the incubation, samples were analysed by SDS–PAGE and western blotting to detect levels of Flag-tagged translation product.
In vivo functional experiments
SNOR-knockout and mutant strain generation
To construct the rtc3∆::ura4+ strain, 300 bp of the rtc3+ 5′ untranslated region (UTR) and 3′ UTR were amplified from the genomic DNA of wild-type cells. The resulting amplicons were cloned into the BamHI/PstI site and KpnI/XhoI site, respectively, of a pSK plasmid containing the ura4+ gene within the PstI/KpnI sites using the Gibson assembly method. A PCR product containing the UTRs and ura4+ was then transformed into ura4-D18 cells using a lithium acetate method61. Transformants were selected on EMM agar plates lacking uracil and the correct deletion was verified by whole-cell PCR using oligonucleotides flanking the rtc3 UTR sequences and internal to ura4+.
To create rtc3 mutant strains, the open reading frame of rtc3+ with 300 bp each of 5′ and 3′ flanking sequences was amplified from wild-type genomic DNA and Gibson cloned into the PstI site of pIRT2. Point mutations in rtc3 were then generated by site-directed mutagenesis and confirmed by DNA sequencing. The resultant pIRT2 constructs were each transformed into the rtc3∆::ura4+ strain, and transformants were isolated on EMM agar plates lacking uracil and leucine. Mutant rtc3 strains were then selected by growing transformants overnight under non-selective conditions and plating on EMM plates containing uracil, leucine, and 5-fluoroorotic acid (1.5 mg ml−1). Replacement of ura4+ with each correct rtc3 mutant was confirmed by whole-cell PCR and DNA sequencing. PCR products and plasmids were sequenced by Plasmidsaurus using Oxford Nanopore Technology with custom analysis and annotation.
Differential interference contrast images were acquired using a Zeiss Axio Observer inverted epifluorescence microscope with Zeiss 63× oil (1.46 NA) objective and captured using Zeiss ZEN 3.0 (Blue edition) software. A singular medial Z slice was obtained. All images were further processed using ImageJ. A list of S. pombe strains used in this study is provided in Supplementary Table 5.
Genomic Flag tagging of SNOR
To add two Flag tags to the N-terminus of SNOR, a CRISPR–Cas9-based approach was used. A guide RNA (gRNA) targeting a region near the SNOR start codon was selected using https://crispr.dbcls.jp/ and cloned into a Cas9 gRNA plasmid to induce a double-stranded break at the desired genomic location. The plasmid backbone was a gift from H. Levin. Cloning was performed using Q5 polymerase, following the manufacturer’s instructions. In parallel, a double-stranded repair template was synthesized as a gBlock, containing in order: 200 nucleotides of the SNOR 5′, two Flag tags beginning with AUG, and 200 nucleotides of the SNOR coding sequence (CDS). S. pombe cells (S. pombe YHL 912 h-, ura4-294 leu1-32 gift from H. Levin) were then co-transformed with the gRNA-Cas9 plasmid and the repair template. The transformation protocol was adapted from Levin et al.62. After transformation, cells were plated on EMM lacking leucine and incubated for 3 days. Next, individual colonies were transferred to YES medium to allow for the loss of the gRNA-Cas9 plasmid. Colonies were checked for Flag tag incorporation by colony PCR as well as western blot. A list of S. pombe strains used in this study is provided in Supplementary Table 5.
Glucose restart experiment and polysome gradient profiling
Wild-type, rtc3∆, and rtc3 mutant cells were grown to mid-log phase at 32 °C in EMM containing 2% glucose overnight, adjusted to the same OD600 of 0.05 in 0.5% glucose EMM, (considered day 0 of the experiment) and incubated continuously for the remainder of the experiment at 32 °C. Each day, an aliquot was removed from each culture and adjusted to an OD600 of 0.25. Tenfold serial dilutions of the normalized samples were spotted on EMM plates containing 0.5% glucose and incubated at 32 °C. A technical replicate was performed at each time point. All samples were spotted on the same plate, and plates were imaged 3 days later. The experiment was performed twice.
For analysing polysome gradients, cells were first incubated in EMM supplemented with 0.5% (w/v) glucose for 7 days. Following glucose depletion, cells were collected, washed with double-distilled H2O, resuspended in fresh YES (Yeast Extract with Supplements) medium to an OD600 of 1 and incubated for 2 h at 30 °C with agitation. Following the incubation, cells were treated with 100 μg ml−1 cycloheximide for 15 min, then collected and lysed as described above (see ‘Ribosome purification’). The clarified lysate was quantified by measuring absorbance at 260 nm, and 10 A260 units were loaded onto a continuous 10–50% sucrose gradient. Gradients were centrifuged at 230,000g for 2.5 h at 4 °C. Polysome gradient profiles were analysed using a BIOCOMP Piston Gradient Fractionator and visualized with GraphPad Prism 10.
Inhibition of eIF5A hypusination by GC7 treatment
Wild-type and rtc3Δ::ura4+ cells were grown overnight to mid-log phase at 30 °C in EMM containing 2% glucose. Cultures were then adjusted to an OD600 of 0.05 in fresh EMM supplemented with 0.5% (w/v) glucose, with or without 20 µM GC7 sulfate (deoxyhypusine synthase inhibitor; MedChemExpress, HY-108314A). This time point was designated day 0 of the experiment, and cultures were maintained at 30 °C for 7 days. To maintain effective inhibition of hypusination, GC7 sulfate was additionally spiked into treated cultures after 3 and 6 days of incubation.
To assess the effect of eIF5A hypusination inhibition on the ability of cells to resume growth, aliquots were collected from each culture on days 1 and 7 and adjusted to an OD600 of 0.25. Cells were subjected to a serial dilution spotting assay as described above. Untreated cells were plated on EMM plates containing 2% glucose, whereas GC7-treated cells were plated on EMM plates containing 2% glucose supplemented with 20 µM GC7 sulfate. Plates were incubated for 3 days at 32 °C prior to imaging.
For polysome gradient analysis, cells were collected after 7 days of incubation in EMM supplemented with 0.5% (w/v) glucose, with or without GC7 treatment as described above. Cells were washed with double-distilled water and resuspended to an OD600 of 1.0 in fresh YES medium, with or without the addition of 20 µM GC7 sulfate. Cultures were incubated for 2 h at 30 °C with agitation, after which polysome profiles were analysed as described above.
3D rendering of tomograms and EM volumes
Models of mitochondrial membranes displayed in Fig. 1 and in the video (Supplementary Video 1) were segmented in Dragonfly and then imported into Blender 4.2 (https://www.blender.org/) using Microscopy Nodes plugin63, together with the corresponding tomogram. Ribosomes were placed in the 3D rendering layout following their positions in the.star files using the plugin Molecular Nodes (v4.4.3). All other electron microscopy volumes were prepared with ChimeraX.
Reporting summary
Further information on research design is available in the Nature Portfolio Reporting Summary linked to this article.